

| << Chapter < Page | Chapter >> Page > |
3/ AM radio transmitter
A typical AM radio transmitter has a block diagram shown below.
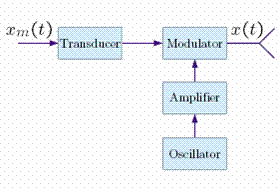 The modulator produces a signal that has the form
Thus, the transmitted signal has the same spectrum as the suppressed carrier AM signal except that the carrier frequency is broadcast. Thus, synchronization of transmitter and receiver is achieved.
4/ Spectrum of transmitted signal
The typical spectrum of an AM station is shown below with the nomenclature defined for its different components.
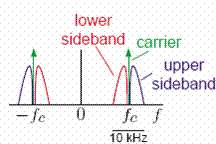
The Federal Communication Commission (FCC) allots 10 kHz of bandwidth for each station. Stations in any one locale differ in their carrier frequencies, which are the numbers indicated on the radio dial.
5/ AM broadcast band
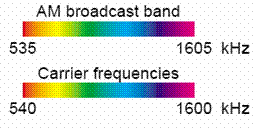
The FCC allocates frequency bands in the radio spectrum (3kHz- 300GHz) for communications purposes. The frequency band from 535 to 1605 kHz is reserved for AM broadcast radio. This is a bandwidth of 1070 kHz. Since each station is allotted a bandwidth of 10 kHz, 107 non-overlapping stations can operate in each locale.
6/ Signal at input to an AM receiver
An AM receiver input spectrum consists of AM signals of different carrier frequencies and different signal strengths resulting from differences in strengths of transmitters and differences in their distances from the receiver.
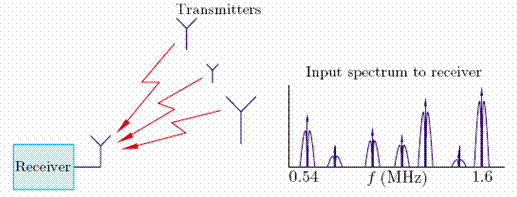
The receiver allows the listener to tune into a station and minimizes the interference of other stations.
7/ Superheterodyne AM receiver
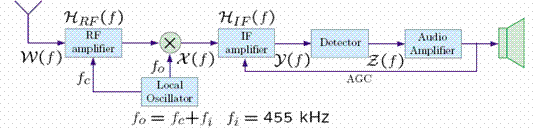
Radio frequency (RF) amplifier. Tunable, broadly frequency selective amplifier that attenuates image station at and has a gain of 5-15 dB.
Local oscillator. Provides frequencies to the RF amplifier and to the modulator.
Intermediate frequency (IF) amplifier. Fixed frequency (at ), highly frequency selective amplifier with a gain of 30 dB.
Audio amplifier. Amplifier with a gain 15-30 dB.
This design has two important attributes: (1) it segregates sharp frequency selectivity from tuning in different stages which simplifies the design; (2) it distributes overall gain over three frequency ranges which improves the stability of the receiver.
The RF amplifier provides some frequency selectivity about the selected station carrier frequency . The modulator shifts the spectrum of the output of the RF amplifier so that the frequency is shifted to with another copy of the spectrum centered on . The IF amplifier is sharply tuned and centered on fi.
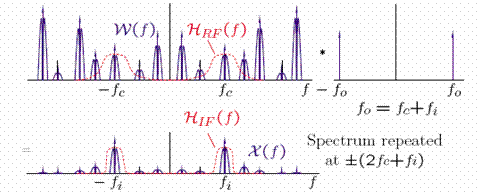
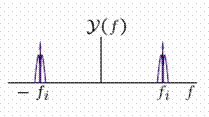
The spectrum of the output of the IF amplifier is the spectrum of the selected station shifted from to . Hence, the output is an AM signal whose carrier frequency is .
This system modulates the selected station from to . However, note that a station whose carrier frequency is is also modulated down to . A purpose of the RF amplifier is to attenuate this image station.
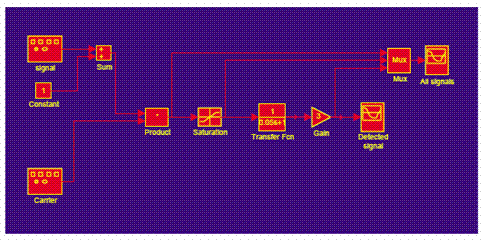
The peak (or envelope) detector demodulates the AM signal. A simple circuit that detects an AM signal is shown below.

The peak detector works well when
For these conditions, the filter attenuates the carrier frequency
but not the frequency of the signal
SIMULINK can be used to study properties of the peak detector. The following is a block diagram of a peak detector that can be found in the matlab folder as peakdetector.m.
IV. CONCLUSIONS
Technological developments, such as the use of modulation for signal transmission, can have enormous social implications. The development of telegraphy, telephony, radio, TV, and now the internet, cable TV, and cellular phones have revolutionized how people relate to each other world wide.
Notification Switch
Would you like to follow the 'Signals and systems' conversation and receive update notifications?

|
|

|
|
|
|
|

|
|

|
|

|
|

|
|

|
|
|
|
|

|